Reports

Security awareness reporting and metrics

Measure what matters: real security behavior, not course completion

Security awareness reporting is the measurement and documentation of how people in an organization respond to threats and training over time. Most platforms reduce it to who completed a course, which says very little about whether your organization is harder to attack. Nimblr's reporting is built around behavior: how people actually respond to simulated attacks and training

The result is a clear picture of your organization's current and historical security awareness, ready for IT teams, auditors, and boards. It is one of the reasons more than 5,000 IT decision-makers have chosen Nimblr.
The Awareness Level: one score, built on behavior

Careful_800
The Awareness Level is Nimblr's measure of security awareness, a score from 0 to 100 calculated for each individual and for the organization as a whole. It is based on how people respond to simulations and courses, and it scores awareness in three areas:

Fraud: phishing, BEC, spoofing, and social engineering

Malware: ransomware, trojans, scripts, and macros

Behavior: physical security, password management, and mobile device management

Users are grouped into four bands: Critical, Low, Normal, and High, so you see exactly who needs attention first. And because the score is based on real responses rather than course completions, it shows where awareness is genuinely improving and where risk remains.

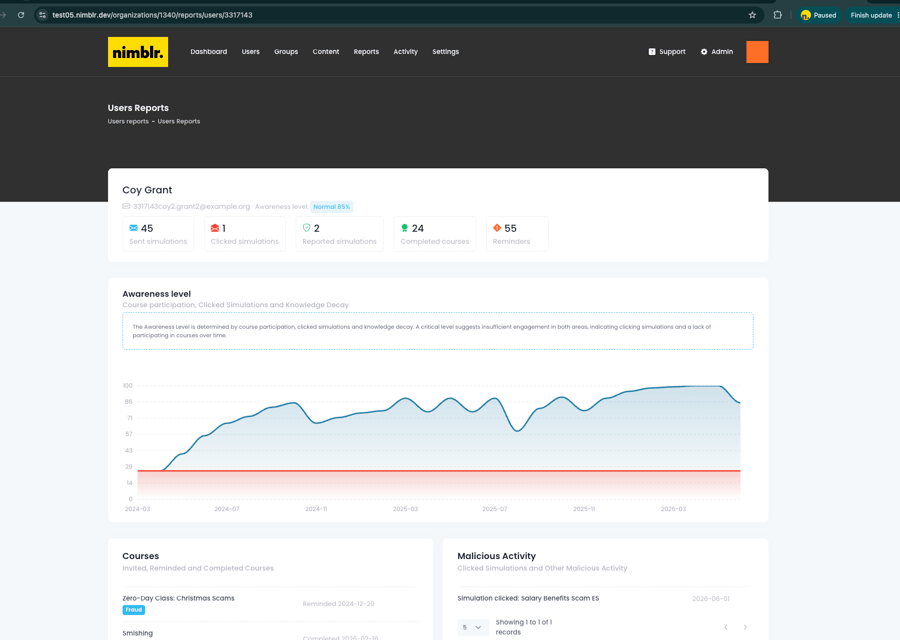
Nimblr screenshot awareness level over time

What the dashboard tracks

The dashboard shows awareness distribution, simulation click rate, course completion rate, and active users, trended over the last six months by default. Metrics are built from monthly summary data, so every month is directly comparable to the last.

When you need more detail, the Reports section supports custom date ranges and drill-down into any single user's history.

Automated reports, ready for the board

Tailored monthly reports are sent automatically, and each admin role sees the scope that matches it: organization admins see the whole organization, group auditors see their assigned groups, and reseller admins see aggregated data across every organization they manage. Nothing to configure.

No manual compiling, no exporting data into slides the night before a meeting. The reports are designed to work as-is for board meetings and management updates, showing progress and trends at a glance.

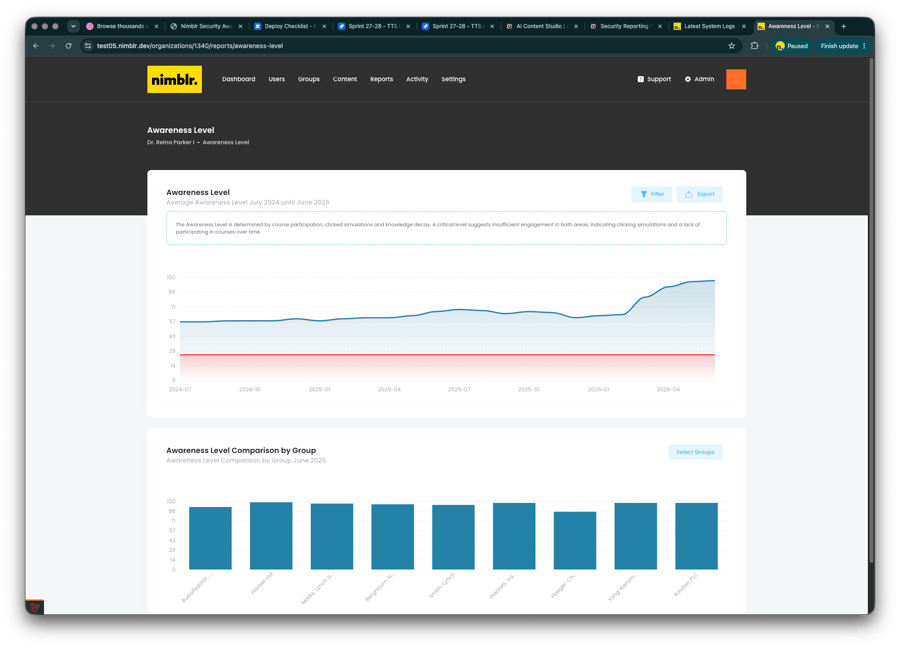
Nimblr security awareness dashboard comparing awareness levels across different user groups with trend charts and group performance metrics.

A full event log of your program

The customer portal gives you complete insight into every training moment in your Security Awareness program. The Event Log records each event as it happens: when a simulated attack is sent, when a user clicks a link in it, and when training invitations go out. So when someone asks what happened with a specific user or campaign, you are not reconstructing it afterward. The record is already there.
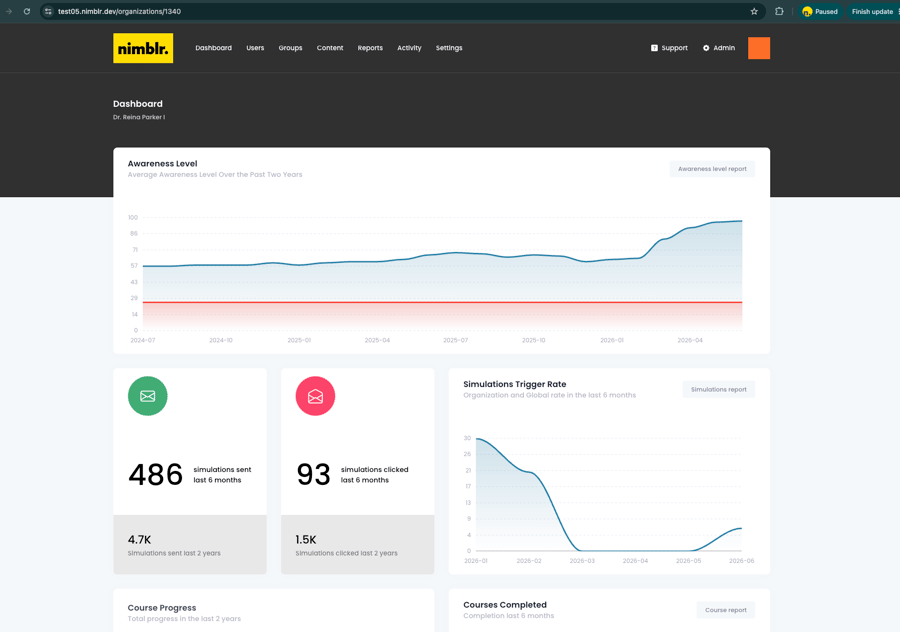
Nimblr dashboard displaying organization-wide security awareness trends and phishing simulation metrics.

How reporting connects to training

Nimblr collects data from all training activity in one platform. Responses to Simulated Attacks, completed Micro Trainings, and Instant Learning sessions automatically update Awareness Level scores and the Event Log, so reporting always reflects the full program.

Training generates the data, and the data shows you where to train next. No exports, no stitching results together from other tools.

FAQ

What is the Nimblr Awareness Level?
 A score from 0 to 100 that measures security awareness based on how each user performs across simulations and courses. Users are grouped into Critical, Low, Normal, and High bands, and the organization gets a collective score.
How does Nimblr measure security awareness?

Nimblr measures behavior rather than course completions. Every simulation response and completed course feeds into individual and collective Awareness Level scores, showing how awareness develops over time.

What areas does the Awareness Level measure?

The Awareness Level covers three areas: Fraud (phishing, BEC, spoofing, and social engineering), Malware (ransomware, trojans, scripts, and macros), and Behavior (physical security, password management, and mobile device management).

Who can see the reports and results?

Organization admins see all groups, group auditors see only their assigned groups, and reseller admins see aggregated data across the organizations they manage. Each role gets its matching scope automatically.

How often are reports sent?

Monthly. Tailored reports are generated and sent automatically, so administrators receive an up-to-date summary without compiling anything manually.

Is the dashboard updated in real time?

Dashboard metrics come from monthly summary data, which keeps trends stable and comparable month to month. The most recent activity is always available in the activity log.

Can Nimblr reports be used for compliance audits?
Yes. Detailed event logs and structured reporting simplify audit readiness and regulatory documentation, helping organizations demonstrate an active security awareness progr

See the reporting in action

Book a demo and let one of our experts walk you through the platform, the Awareness Level, and how quickly you can get started.